Simple optical characterization of new high index chalcogenide glass
Thomas Hingant, Pol Briantais, Raphaël Proux, Mathieu Rozé, Petr Němec, Antoine Bréhault, Laurent Calvez, Xiang-Hua Zhang, Yann Guimond, John W. Franks
Article shared under SPIE's Green Open Access Policy.
ABSTRACT
In this paper we present techniques for measuring efficiently the optical properties of chalcogenide glasses. In particular we discuss methods for measuring refractive index and the variation of refractive index with temperature. We then apply these techniques to a new glass composition and demonstrate a high index of 3.26 @10 μm and a large thermo-optic coefficient of 1.99⋅10−4 K−1. These properties make this glass a good candidate for replacing germanium.
Keywords: infrared, chalcogenide, refractive index, thermo-optic coefficient.
1. INTRODUCTION
Chalcogenide glasses have become ubiquitous in optics for Long Wave Infra-red (LWIR) in the past twenty years. There are many reasons why this is true, but it is certain that steady pressure for better lenses has driven this choice. Better lenses can be defined as lower cost, more compact, sharper imaging, more light collection or sometimes all of these. The chalcogenide glasses have many useful qualities that help designers to meet this increasing demand. Moldability is also a key benefit which helps to reduce cost for higher volumes.
In spite of these properties, many lens designs still use crystalline materials such as germanium. Beyond its high transparency in the Mid Wave and Long Wave Infra-red (MWIR and LWIR) bands, germanium indeed displays a high index of 4.004 at a wavelength of 10 μm, combined with a large thermo-optic coefficient. Replacing germanium with a chalcogenide equivalent would be desirable, at the very least for moldability. However, this requires the optimization of a glass composition, to replicate the optical properties of Germanium, good transparency, high index, large thermo-optic coefficient. To this aim, we need to dispose of efficient measurement techniques for all of these quantities, that would ideally require minimal sample preparation.
In this spirit, we will propose three techniques to measure transparency, refractive index and thermo-optic coefficient on simple glass slabs. The only constraint imposed on all samples is a parallel polishing of two faces. We will apply the measurement techniques to a new candidate glass composition for replacing germanium and measure its transparency, its refractive index and its thermo-optic coefficient.
2. MEASURING BULK LOSSES WITH SLABS
To fabricate lenses, it is first important to use a glass with minimal losses. A simple and common way to measure the bulk losses is to measure the transmission of polished slabs on a spectrophotometer. For these samples, losses can happen at the interfaces or in the bulk material. The interface losses are mostly driven by scattering and by so-called Fresnel losses due to the refractive index mismatch with air [1]. For a polished piece of glass, only Fresnel losses contribute. Losses in the bulk can be assessed by measuring the transmission of two slabs with two different thicknesses, to get rid of the surface contribution. The point that we would like to stress here is that the estimation of bulk losses must take into account the fraction of energy that undergoes multiple reflections within the samples. This is schematically described in Figure 1a, where we have only depicted rays that contribute to the measured transmission signal. An incoming beam of intensity 𝐼in goes through a polished slab of glass and the intensity 𝐼out is measured on a spectrophotometer. 𝐼out is the sum of all the contributions 𝐼0, 𝐼1, 𝐼2, … from the multiple reflections within the sample. Figure 1

Figure 1 - Measuring the transmission with slabs of several thicknesses. (a) principle of the measurement. An incident beam with intensity Iin goes through the glass slab and the resulting intensity Iout is measured. (b) Transmission spectra measured for several slab thicknesses. The legend corresponds to the thickness of the slab in cm. (c) Comparison of the transmission as a function of the slab thickness with (with reflections) or without (𝑰0 only) taking into account the multiple reflections in the slab. Inset: corresponding data fitted with the multi-reflection model. The I0 only term refers to the law of Beer-Lambert computed with the fitted bulk losses. (d) Linear loss coefficient 𝜶 fitted for each wavelength.
Figure 1b shows transmission spectra measured for several thicknesses of slabs made of the new glass composition. In this experiment, we chose the spectral resolution to be low enough in regard of the slab thickness 𝑡 so that all beams can be considered incoherent. The intensity at the output is therefore the sum of all intensities. We call 𝑇 and 𝑅 the transmission and reflection coefficients at the interfaces and 𝛼 the linear coefficient for bulk losses. Then, measured intensity is:
![]()
or equivalently
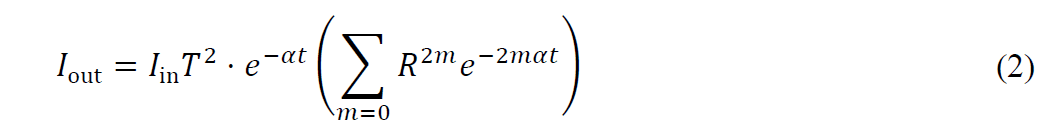
This is a geometric series, so we can rewrite it as:
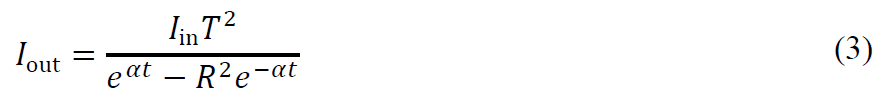
A single pass in the slab would yield only the first term of equation (1) i.e. 𝐼out=𝐼0𝑇2⋅𝑒−𝛼𝑡. If 𝛼 is small (low bulk losses) and 𝑅 is close to 1 (high reflectivity), 𝐼out is substantially higher than the simple pass approximation. Figure 1c shows how 𝐼out behaves as a function of slab thickness when considering the single pass model (𝐼0 only) or the multiple reflections model given by equation (3). The inset shows the transmission values from the spectra of Figure 1b at a given wavelength, plotted as a function of slab thickness. By fitting this data with equation (3), we are able to infer the value of the bulk losses 𝛼. Overall, both curves are very similar, especially when the thickness of the slab is large compared to the bulk losses rate. For small thicknesses, however, the slopes of the curves differ slightly, meaning that using a single pass approximation results in a modest overestimation of the losses. Therefore, for thin glass slabs, it is more appropriate to take multiple reflections into account as in the equation (3). Under this hypothesis, we have displayed the fitted value of the bulk losses 𝛼 in our new composition in Figure 1d. We observe that the glass presents minimal attenuation in the entire MWIR to LWIR band.
3. FAST MEASUREMENT OF THE REFRACTIVE INDEX
A second important point is to optimize the refractive index. The most recommended methods for measuring refractive index is to use a prism and measure the deviation of an incoming monochromatic beam [2]. This is a however a demanding experiment which requires time and, importantly, the manufacture of complex samples. Therefore, it is not suited for an optimization task, where numerous samples will be measured in a short timeframe. In this work, we propose to use a different method, which merely relies on an accurate transmission spectrum measurement to infer the entire dispersion curve over a transparency region. The underlying idea is to take advantage of interference occurring in a plane-parallel glass plate, similar to a low reflectivity Fabry-Perot interferometer. This is schematically described in Figure 2a. The phase 𝜙 accumulated by the beam of light for each roundtrip in the material, which also describes the interference pattern is given by:
𝜙=2𝜋⋅𝜎2𝑡𝑛 (4)
where 𝑛 is the refractive index, 𝑡 is the thickness of the slab and 𝜎 is the wavenumber. 𝜙 can increase by increasing 𝑡 or 𝜎. We should therefore observe a modulation in the transmission spectrum. Note that the distance expected between two fringes is 𝛿𝜎=1/2𝑛𝑡, which corresponds to ∼1 cm−1 for an index 𝑛∼2.5 and a 2 mm-thick slab. Therefore, if we assume that we need to sample fringes with about 10 points, a sampling of ∼0.1 𝑐𝑚−1 is required, which is demanding but achievable with good instruments. An example of such a fringe pattern is shown in Figure 2b, where the modulation is clearly observable, particularly in the inset. The idea to use this interference pattern to measure the refractive index has been introduced by R. Swanepoel [3]. The original idea was to use the amplitude of the modulation to determine the index and the period to determine the thickness. However, the amplitude of the fringes is also affected by external parameters such as absorption or instrument resolution, which limits the usability of this measurement. The Swanepoel method has been perfected in more recent work from the group of T. Benson [4]. The difference with the present work is discussed further.

Figure 2 – Interference fringes in a transmission spectrum. (a) Principle of the experiment. Multiple reflections through a plane-parallel plate lead to interference. If the slab is thin enough with respect to the spectrophotometer resolution, the interference pattern can be observed in the transmission spectrum. (b) Example of such a spectrum measured with a slab of the new glass composition studied in this work.
In order to retrieve the phase, the transmission signal is preprocessed to keep only the modulation. To achieve this, we use a sliding window of width larger but comparable to the period of the fringes. We subtract the mean value and normalize the modulation between -1 and 1. We can then infer the phase accumulation by performing a demodulation with a Hilbert transform [4]. This gives the instantaneous phase with an unknown offset 𝜙0, which describes the fact that we do not know the order of interference, i.e. how many wavelengths fit in the considered optical path 2𝑡𝑛:
𝜙=2𝜋⋅𝜎2𝑡𝑛+𝜙0 (5)
In the so-called improved Swanepoel approach, the method to remove 𝜙0 is to measure the sample at several angles of incidence. The fringes will shift differently depending on the order of interference. This limits the measurement to thin films of a few tens of microns in our case [5].
In this work the approach to remove 𝜙0 and consequently retrieve the index is to derive the phase with respect to the wavenumber.
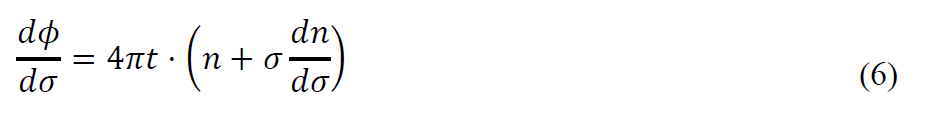
From there, we need to make assumptions on the dispersion to estimate the index. The first approach is to assume that the index varies slowly enough with the wavenumber i.e. 𝜎(𝑑𝑛/𝑑𝜎) is negligible, so that 𝑛≈(𝑑𝜙/𝑑𝜎)/4𝜋𝑡. This is equivalent to counting the fringes and is acceptable to some extent. However, it gives limited information on the dispersion. A more accurate approach is to make assumptions on the shape of the dispersion by using models commonly used in the infrared. For example, we can use the Cauchy formula [2] for the refractive index, which accurately describes transparent media where the dispersion is driven by one resonance:
𝑛𝐶= 𝐴+𝐵𝜎2 (7)
or one of the Sellmeier formulae [2,6], which model the dispersion far from optical transitions with a strength 𝐴𝑖 and a resonance wavelength √𝐵𝑖. For our chalcogenide glasses, in the infrared part of the spectrum, the dispersion is influenced both by the electronic transitions due to the band gap at shorter wavelengths and by the phonon bands at higher wavelengths. In such a case, a two-term Sellmeier formula is usually well suited [2]:
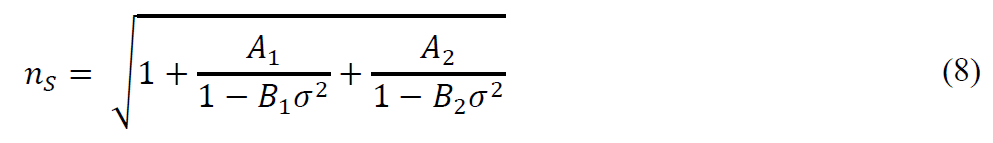
In both cases (7) or (8), we can rewrite equation (6) as an analytical function of the parameters 𝐴𝑖 and 𝐵𝑖. Therefore, the parameters of the model can be used to fit the phase derivative and assess the refractive index as a function of the wavenumber. The interesting aspect of this approach is that we get model parameters that can be used directly in an optical design software to start optimizing systems with the new glass composition.

Figure 3 - Example of the method on GASIR®1. (a) Transmission spectrum, taken with a sampling of 0.06 cm-1 on a 2.054 mm-thick slab. The resolution is 1 cm-1 which induces a reduction in contrast (b) Zoom on the fringes. (c) Fringes of (b) normalized with the offset subtracted. (d) Derivative of the phase of the Hilbert transform, normalized by 4π times the thickness. (e) Experimental data form (d) smoothed with a sliding mean. Only points where the standard deviation is < 0.2 have been kept. The fit of the data according the Cauchy and Sellmeier equations have been added to the graph.
To try and test the method, we have first applied it to GASIR®1, which is a broadly used glass with a well-known refractive index [7]. The whole process is illustrated in Figure 3. First, a transmission spectrum is measured on a 2.054 ± 0.001 mm-thick plane-parallel plate (Figure 3a), with a Fourier Transform Infrared (FTIR) spectrophotometer. To resolve the interference pattern, the spectrum is oversampled to 0.06 cm-1. The measurement is performed with a lower resolution of 1 cm-1. This induces a loss in contrast but does not affect the phase of the interference pattern, which illustrates the robustness of our method. The fringes visible in the raw transmission spectrum (Figure 3b) are shown after normalization in Figure 3c. Then, we perform a demodulation with a Hilbert transform and a derivation numerically to retrieve the phase derivative of equation (6) (Figure 3d). At this stage, we can note that the derived signal is quite noisy, especially in the atmospheric absorption regions. This is because the period of the fringes is close to the resolution of the instrument and any noise in the signal can cause the phase to fluctuate. The noise is even more pronounced below 2 μm and above 15 μm, where material absorption dominates. Consequently, before performing the fit, we filter out the high-frequency noise by computing the moving average and standard deviation of the signal. Only the regions where the standard deviation is below 0.2 are kept for the fit. This threshold has been chosen to keep the relevant data while removing most of the large peaks of standard deviation due to measurement noise. Figure 3e shows the data used for the fit and the corresponding standard deviation capped at 0.2. The data is fitted according to equation (6) using either Cauchy formula (7) or Sellmeier formula (8). As expected, Sellmeier formula achieves a better match with the data.

Figure 4 - Dispersion curves for (a) GASIR®1 (b) GASIR®5 and (c) the composition studied in this paper.
With the fit parameters obtained in Figure 3e, we have an analytic expression for the refractive index, which is plotted in Figure 4. Figure 4a shows the refractive index as a function of wavelength (dispersion curve) for the GASIR®1 sample measured in Figure 3. The same analysis was carried out for GASIR®5 (Figure 4b) and the new composition studied in this paper (Figure 4c). For GASIR®1 and GASIR®5, the dispersion curve derived in this work (fit Cauchy, fit Sellmeier) is plotted alongside the nominal dispersion from the Umicore catalogue. The latter was originally derived from measurements of minimum of deviation on prisms [7]. In addition, the dispersion curve was also extracted from ellipsometry measurements using the Cody-Lorentz model in the near-infrared (Ellipsometry NIR) and Sellmeier dispersion in the mid-infrared (Ellipsometry MIR) [8,9].
We note that the Cauchy formula exhibits large deviations, up to 0.07 at 18 μm for GASIR®1 in the MWIR and LWIR regions. This is expected since the dispersion is significantly driven by phonon transitions in these regions. In contrast, the Sellmeier formula provides an excellent qualitative agreement on the dispersion shape. While for GASIR®1, ellipsometry is closer to the Umicore catalogue dispersion, this method is closer to the nominal dispersion for GASIR®5. For both glasses, the maximum deviation with the nominal values of the catalogue are of the order of 0.01, which we will assume to be the accuracy of the method. Further work will need to be performed to better assess the uncertainty, including using exactly the same glass in the prism deviation method of measurement. The precision is currently not limited by the accuracy on the thickness of the slab 𝑡, so it could be possible to use thinner samples to improve the quality of the fringes and better reject transmission fringes.
Since we have achieved good accuracy on well-known GASIR® samples, we have applied our method to the new composition and derived an index of 𝑛@10 μm=3.26±0.01. This value is in agreement to the value 3.27 measured by ellipsometry. The new composition has a much higher refractive index than GASIR®5, thus making it a good candidate for a possible alternative to germanium.
4. MEASUREMENT OF THE THERMO-OPTIC COEFFICIENT
The last optical parameter that we need to measure before using the glass in a system design is the thermo-optic coefficient 𝑑𝑛/𝑑𝑇. For this we use again the interference occurring within a plane-parallel glass plate. The principle is similar to the experiment described in the work of J. Mangin et al. [10]. It is described in Figure 5a. A monochromatic laser beam is directed onto the sample and interference occurs between the multiple reflections at the front surface and within the sample. Once again, the phase governing the interference is given by equation (4)
![]()
where we have simply replaced the wavenumber 𝜎 by the wavelength 𝜆. The sample is placed in an oven, in vacuum at a temperature 𝑇. Both the length 𝑡(𝑇) and the index 𝑛(𝑇) change with temperature, leading to fringes in the reflected light intensity. Measuring the thermal expansion 𝑡(𝑇) profile separately allows us to retrieve the evolution of the refractive index with temperature.

Figure 5 - Measuring the thermo-optic coefficient (dn/dT) (a) Principle of the experiment. A laser beam is reflected on the sample inside an oven. The interference signal is measured on an MCT detector. (b) Example of a measured signal as a function of temperature. (c) Signal measured in (b) normalized and smoothed with a moving average and corresponding fit. Here dn/dT = 1.99 ± 0.1 ·10-4 K-1.
Figure 5b shows the example of a measurement taken on a 10.000 mm-thick sample of the new glass, with a CO2 laser beam at 10.6 μm wavelength. The thermal expansion coefficient of the sample was measured to be 16.7⋅10−6 𝐾−1 on a commercial dilatometer. With this value and the refractive index measured in the previous section, we can fit the fringes measured in Figure 5b with a quadratic refractive index profile:
𝑛(𝑇)=𝑛0+𝑛1(𝑇−𝑇0)+𝑛2(𝑇−𝑇0)2 (10)
where 𝑇0=20 °C is the reference temperature for our measurement. In practice, the signal is normalized and smoothed before fitting, in order to reject slow variations of the signal level due to experimental drifts such as laser intensity or components dilation. The result of the fit is presented in Figure 5c. It yields 𝑛1=𝑑𝑛𝑑𝑇⁄(𝑇0)=1.99±0.1⋅10−4 K−1 and 𝑛2=2.38⋅10−7 K−2. In practice, 𝑛1 is five times larger than with GASIR®5. The large contrast in thermo-optic coefficients can allow for efficient compensation of thermal drifts in optical designs [11], in a similar fashion than with germanium.
5. CONCLUSION
In order to find a good chalcogenide glass to replace germanium, we need to optimize its optical properties, hence to measure them efficiently. Here, we present three simple techniques to measure bulk losses, refractive index and thermo-optic coefficient on simple glass samples. The samples are only required to be polished plane-parallel glass plates. As an example, we have applied the three methods to a candidate new composition. This new glass presents a very good transparency in the MWIR and LWIR bands, a refractive index 𝑛=3.26±0.01 and a thermo-optic coefficient 𝑑𝑛𝑑𝑇⁄(20 °C)=1.99±0.1⋅10−4 K−1 at a wavelength of 10 μm. This makes it a suitable candidate for replacing germanium in many optical systems, whether it is required for its high index or for its large thermo-optic coefficient.
ACKNOLEWDGEMENTS
We thank Alex Binsley, Maxime Lebaron, Valentin Reux and Virginie Nazabal for their help in this work and for fruitful discussions.
REFERENCES
[1] M. Born, E. Wolf, Principles of Optics, “Electromagnetic Theory of Propagation, Interference and Diffraction of Light”, Cambridge University Press, https://doi.org/10.1017/CBO9781139644181
[2] Y. Fang, D. Furniss, D. Jayasuriya, H. Parnell, Z.Q. Tang, D. Gibson, S. Bayya, J. Sanghera, A.B. Seddon, T.M. Benson, Methods for determining the refractive indices and thermo-optic coefficients of chalcogenide glasses at MIR wavelengths Optical Materials: X,Volume 2, 2019, https://doi.org/10.1016/j.omx.2019.100030.
[3] R Swanepoel, “Determination of the thickness and optical constants of amorphous silicon” , J. Phys. E: Sci. Instrum. 16 1214 (1983)
[4] Fang, Y., Jayasuriya, D., Furniss, D. et al., “Determining the refractive index dispersion and thickness of hot-pressed chalcogenide thin films from an improved Swanepoel method.” Opt. Quant. Electron 49, 237 (2017). https://doi.org/10.1007/s11082-017-1057-9
[5] Julius O. Smith, “Mathematics of the Discrete Fourier Transform (DFT), with Audio Applications Second Edition”, W3K Publishing, 2007, ISBN 978-0-9745607-4-8.
[6] W. Sellmeier, “Zur Erkarung der abnormen Farbenfolge im Spectrum einiger, Substanzen“ Annalen der Physik und Chemie 210 (1871) 272–282.
[7] P. Lucas et al., “Structural and chemical homogeneity of chalcogenide glass prepared by melt-rocking”, J. Chem. Phys. 150, 014505 (2019); https://doi.org/10.1063/1.5054704
[8] P. Němec, M. Olivier, E. Baudet, A. Kalendová, P. Benda, V. Nazabal, “Optical properties of (GeSe2)100−x(Sb2Se3)x glasses in near- and middle-infrared spectral regions”, Materials Research Bulletin 51 (2014) 176–179; http://dx.doi.org/10.1016/j.materresbull.2013.11.050
[9] P. Hawlová, F. Verger, V. Nazabal, R. Boidin, P. Němec, “Accurate Determination of Optical Functions of Ge–As–Te Glasses via Spectroscopic Ellipsometry”, J. Am. Ceram. Soc. 97 (2014) 3044-3047.
[10] J. Mangin, P. Strimer and L. Lahlou-Kassi, “An interferometric dilatometer for the determination of thermo-optic coefficients of NLO materials”, Meas. Sci. Technol. 4 826 (1993)
[11] J. Verplancke, N. Schuster, J. W. Franks, “Using material advances in chalcogenide glasses to improve imaging lenses in the 8-14 μm waveband”, Proceedings Volume 10181, Advanced Optics for Defense Applications: UV through LWIR II; 101810E (2017) https://doi.org/10.1117/12.2261995